I recently tested positive for covid and tried to keep a detailed log of the tests, results, and symptoms I had so I could see if I learned anything from it.
Here is the data. I mark day 0 as the first day of a positive test. When I say “Rapid” here I mean Antigen/at-home test.
| Day # | Test Type | Result | Symptoms |
| -4 | Rapid | Negative | – |
| -3 | Rapid | Negative | – |
| -2 | PCR | Negative | – |
| -1 | – | – | |
| 0 | Rapid | Negative | – |
| 0 | PCR | Negative | – |
| 0 | PCR | Positive | Minor sore throat |
| 1 | Rapid | Positive | Stuffy nose |
| 2 | Rapid | Positive | Minor stuffy nose |
| 3 | Rapid | Positive | Minor stuffy nose |
| 4 | Rapid | Positive | Minor stuffy nose |
| 5 | Rapid | Positive | – |
| 6 | Rapid | Positive | – |
| 7 | Rapid | Positive | – |
| 8 | Rapid | Negative | – |
| 9 | Rapid | Negative | – |
Overall I had almost no symptoms, the stuffy nose I had was very minor and only at small points during the day. I would say I was generally asymptomatic. For me, it was fewer symptoms than a normal cold, flu, or allergies.
The day 0 data is a bit confusing, where I had two negative tests and 1 positive test in the same day.
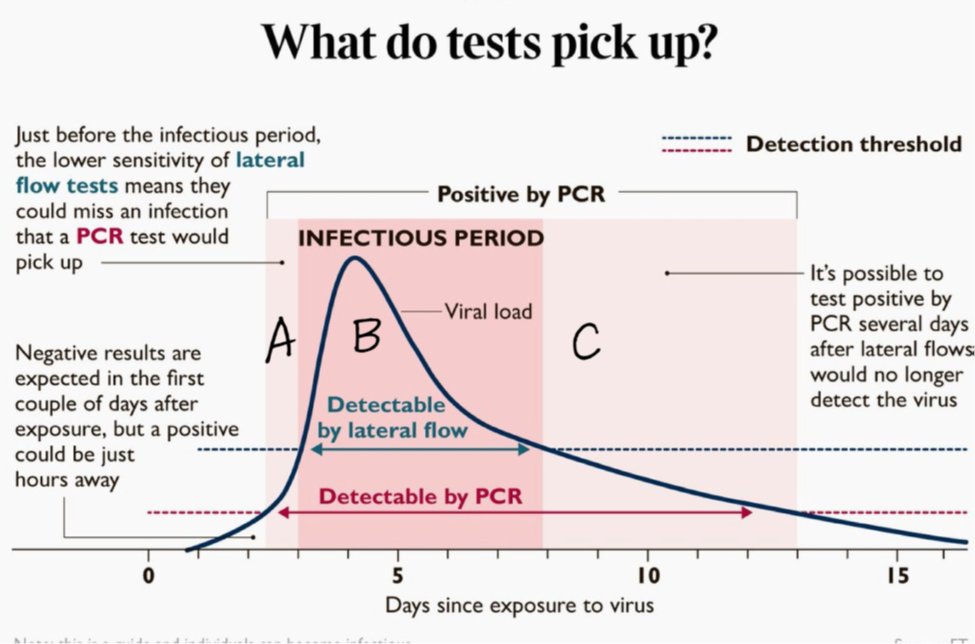
The tests line up very similarly to the graph here, from this thread.

A is the PCR+, Antigen -.
B is PCR+, Antigen+.
C is PCR+, Antigen-.
Day 0 on my table corresponds to A where I had PCR+, Antigen-.
Day 1-7 correspond to B where I had Antigen+.
So this is very similar; where the chart has a 5 day B section, I had 7 days.
I think there is a lot of nuance to the uses and purposes of a PCR vs. Antigen test, and that the general public health communications on them have been unclear. Also the availability of tests is an issue. The whole thing is generally a mess– but my experience of covid was less than a minor cold.
